


Many companies choose Matomo because it doesn’t share user details with advertising systems and allows for keeping data in virtually any location on the globe. But if you’re reading this article, you probably know this already. And you also know that Matomo sometimes faces performance issues.
This won’t happen if you run small analytics projects with reports based on low traffic. However, when using Matomo on a high- or medium-traffic website, you may encounter the following issues:
- You have to wait two or more hours to generate a report or create a segment
- User interface is not responsive and doesn’t show any data for certain date ranges
- Matomo stops aggregating reports’ data in real time
This makes working with data a bit difficult, especially if you want to compare different segments or create multiple custom reports.
Matomo’s performance will depend on how you use the platform and your organization’s analytical maturity. If you’re looking mainly for a reporting tool, Matomo can be a perfect solution even for relatively high traffic sites. On the other hand, if you use the tool for actively analyzing the digital performance, the segment creation slows down the whole analytical process. You want to have the data for your newly created segment now, not in six hours and certainly not tomorrow.
Mikko Piippo, analytics specialist and founding partner at Hopkins Oy
Piwik PRO shared the same backend and problems as Matomo. That changed in 2018 with the introduction of our new Analytics module that uses ClickHouse database. But we still remember the challenges we faced before the upgrade.
If you’d like to know more about our journey to a better, more efficient product architecture, be sure to read this: Piwik PRO & ClickHouse: How we used it to make our reports faster and more efficient
Based on that experience, we’ll show you the roots of Matomo’s performance issues, the impact they have on your reporting and potential fixes for them.
The underlying cause of Matomo performance issues
Two key factors affect performance of the platform: Matomo’s database and backend.
Matomo’s database
Matomo is built on MySQL database management system (DBMS). The architecture works fast for high-level reports, segments created ahead of time and small sets of data. But it slows down significantly when you build reports and segments ad hoc and out of significant volumes of data.
This happens because MySQL is a row-oriented management system. It needs to scan whole rows of data to find the relevant pieces of information and generate a report or segment out of it. The more rows of data it has to search through, the longer and more resource-consuming the operation becomes:
To give you a comparison: This is how a columnar database, an alternative to a row-oriented DBMS, works. By storing data in columns rather than rows, the database can be more precise and quicker in accessing the data it needs to answer a query

Here you can read more about the differences between columnar and row-oriented database management systems.
To prevent your database from overloading, Matomo recommends turning on the archiving process. Archiving takes place from every hour to every 24 hours, depending on the data volume. During this process, Matomo runs through the logs and precalculates data in all your reports for each day, week, month and year.
Here’s how the preprocessing works:
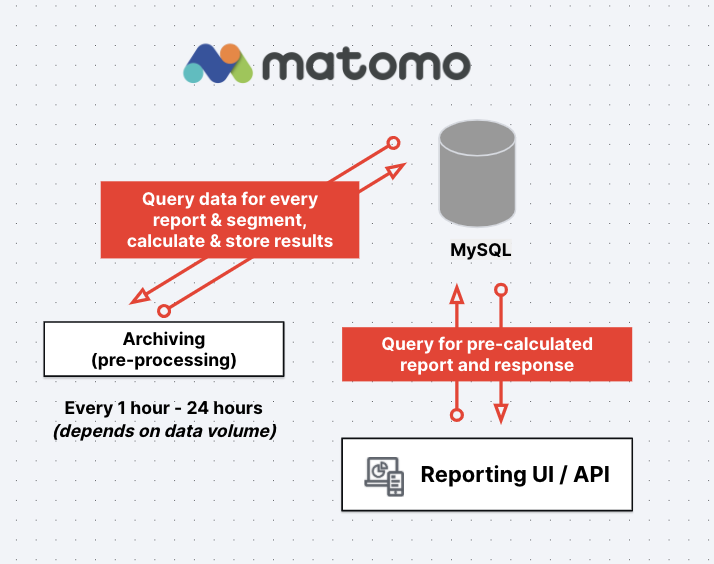
As a result, Matomo’s database doesn’t need to read every row of data to answer your query. Instead, it can rely on precalculated data. But as a side effect, every new report and segment has to wait for the preprocessing cycle to complete. For websites with medium or high traffic volumes, it’ll often take more than two hours.
Matomo’s backend
Another thing is that Matomo is a complex, monolith PHP application. This makes scaling, maintaining and rewriting the platform more difficult compared to architectures built out of smaller, more diverse components and newer programming languages.
Because of that, Matomo’s backend is also more prone to bug regressions than more modern backend architectures.
Possible solution: Fine-tune your setup
Adjusting your database, server configuration and product settings might help you gear Matomo for top performance. For more details, read the product guidelines.
However, following this advice also requires expertise in server and database maintenance. Also, although the archiving cycle may become shorter, you won’t be able to free yourself from this requirement for reports based on a significant volume of data.
How Matomo’s architecture affects your reporting flexibility
Matomo’s architecture impacts how fast it generates reports for medium- and high-traffic websites. But it also influences the platform’s feature set, as some analytics functionalities rely heavily on data processing efficiency. Here you can find some notable examples:
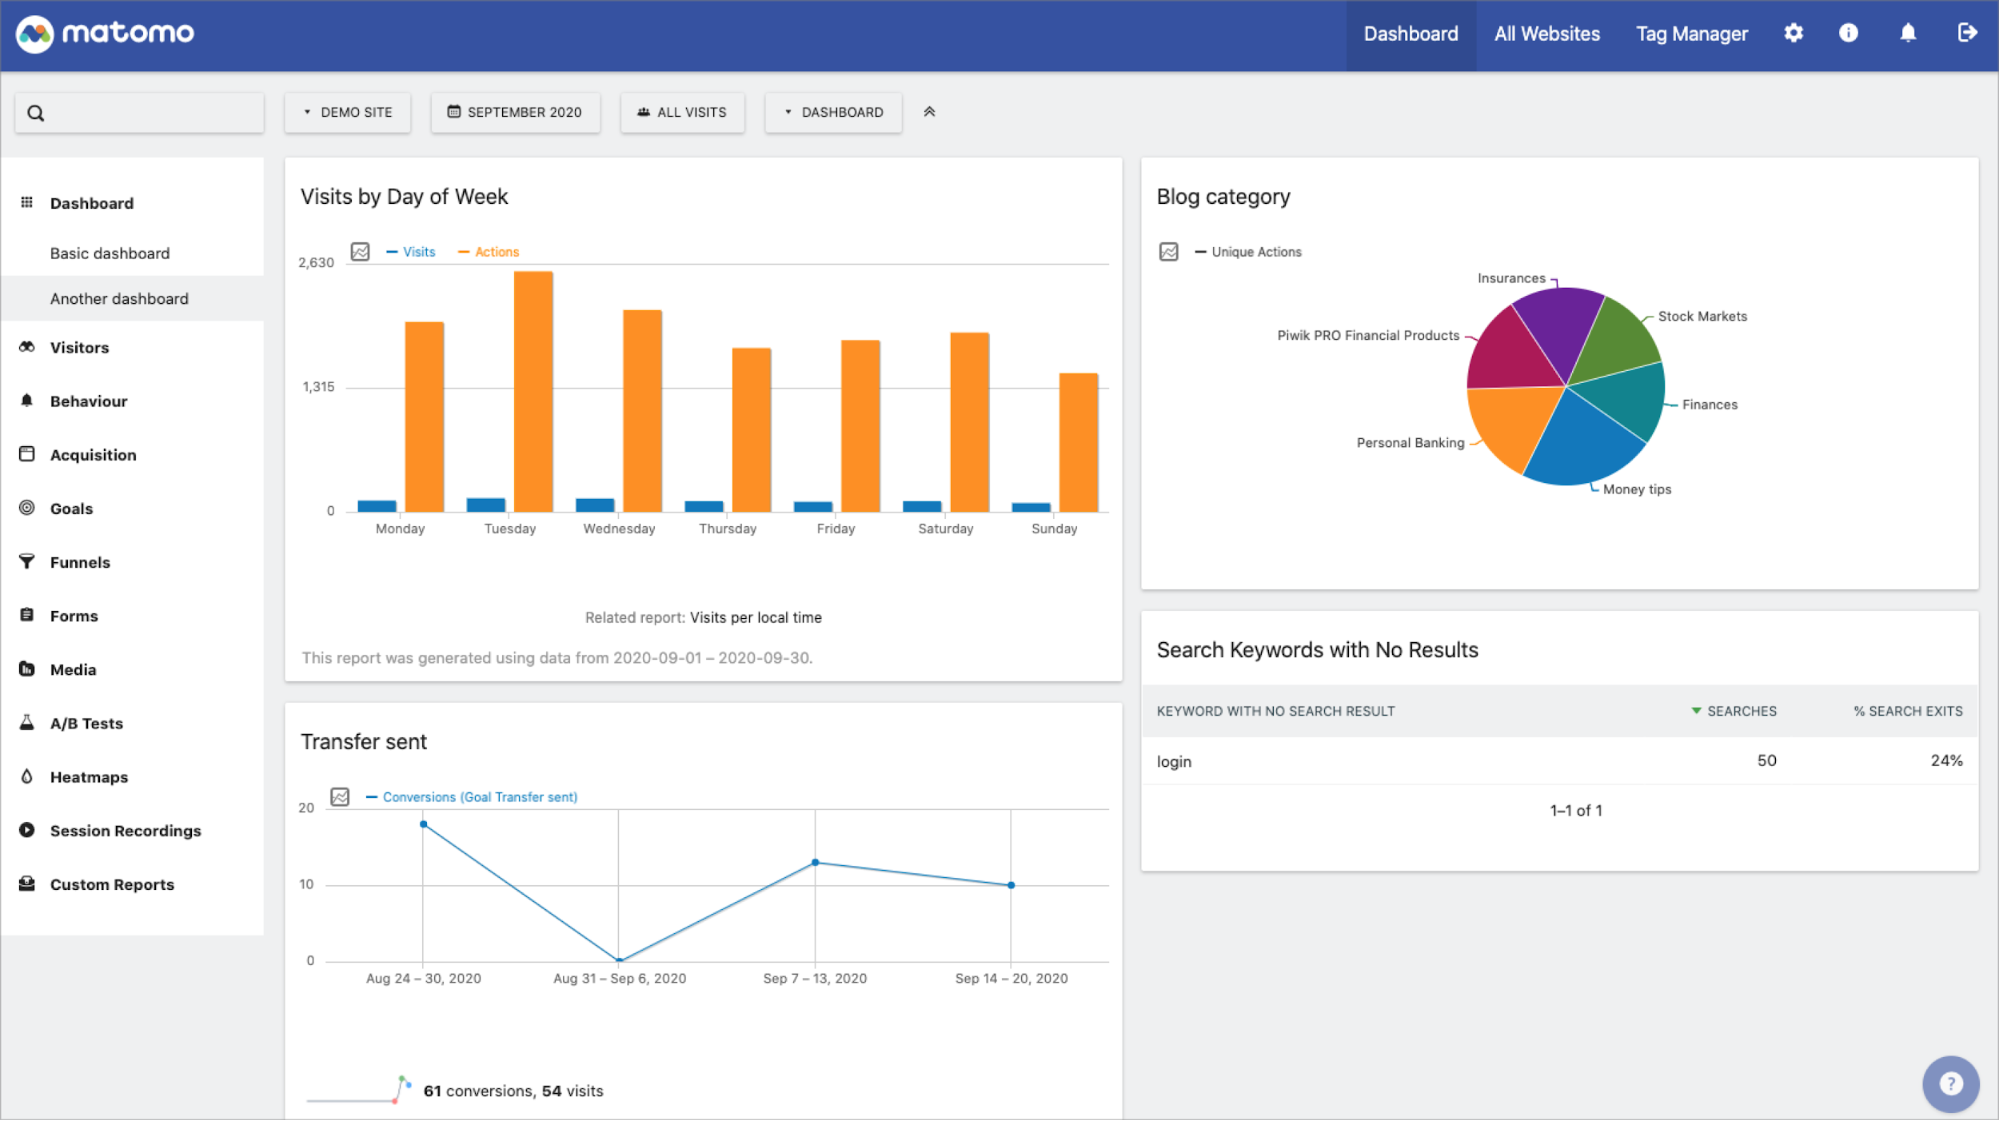
Dashboards and custom reports
Matomo offers a great collection of archived custom reports to use as widgets on your dashboards. But creating new custom reports you could use as widgets on your dashboards requires preprocessing, and it takes between one and 24 hours.
What’s more, you can’t use separate filters and segments for each widget on your dashboard.
The variety of custom reports is also limited. Users can choose between the following types of report:
- Table – Shows the report data in a standard table. Can be switched to a bar graph, pie chart or cloud chart
- Evolution – Shows the performance of selected metrics over time
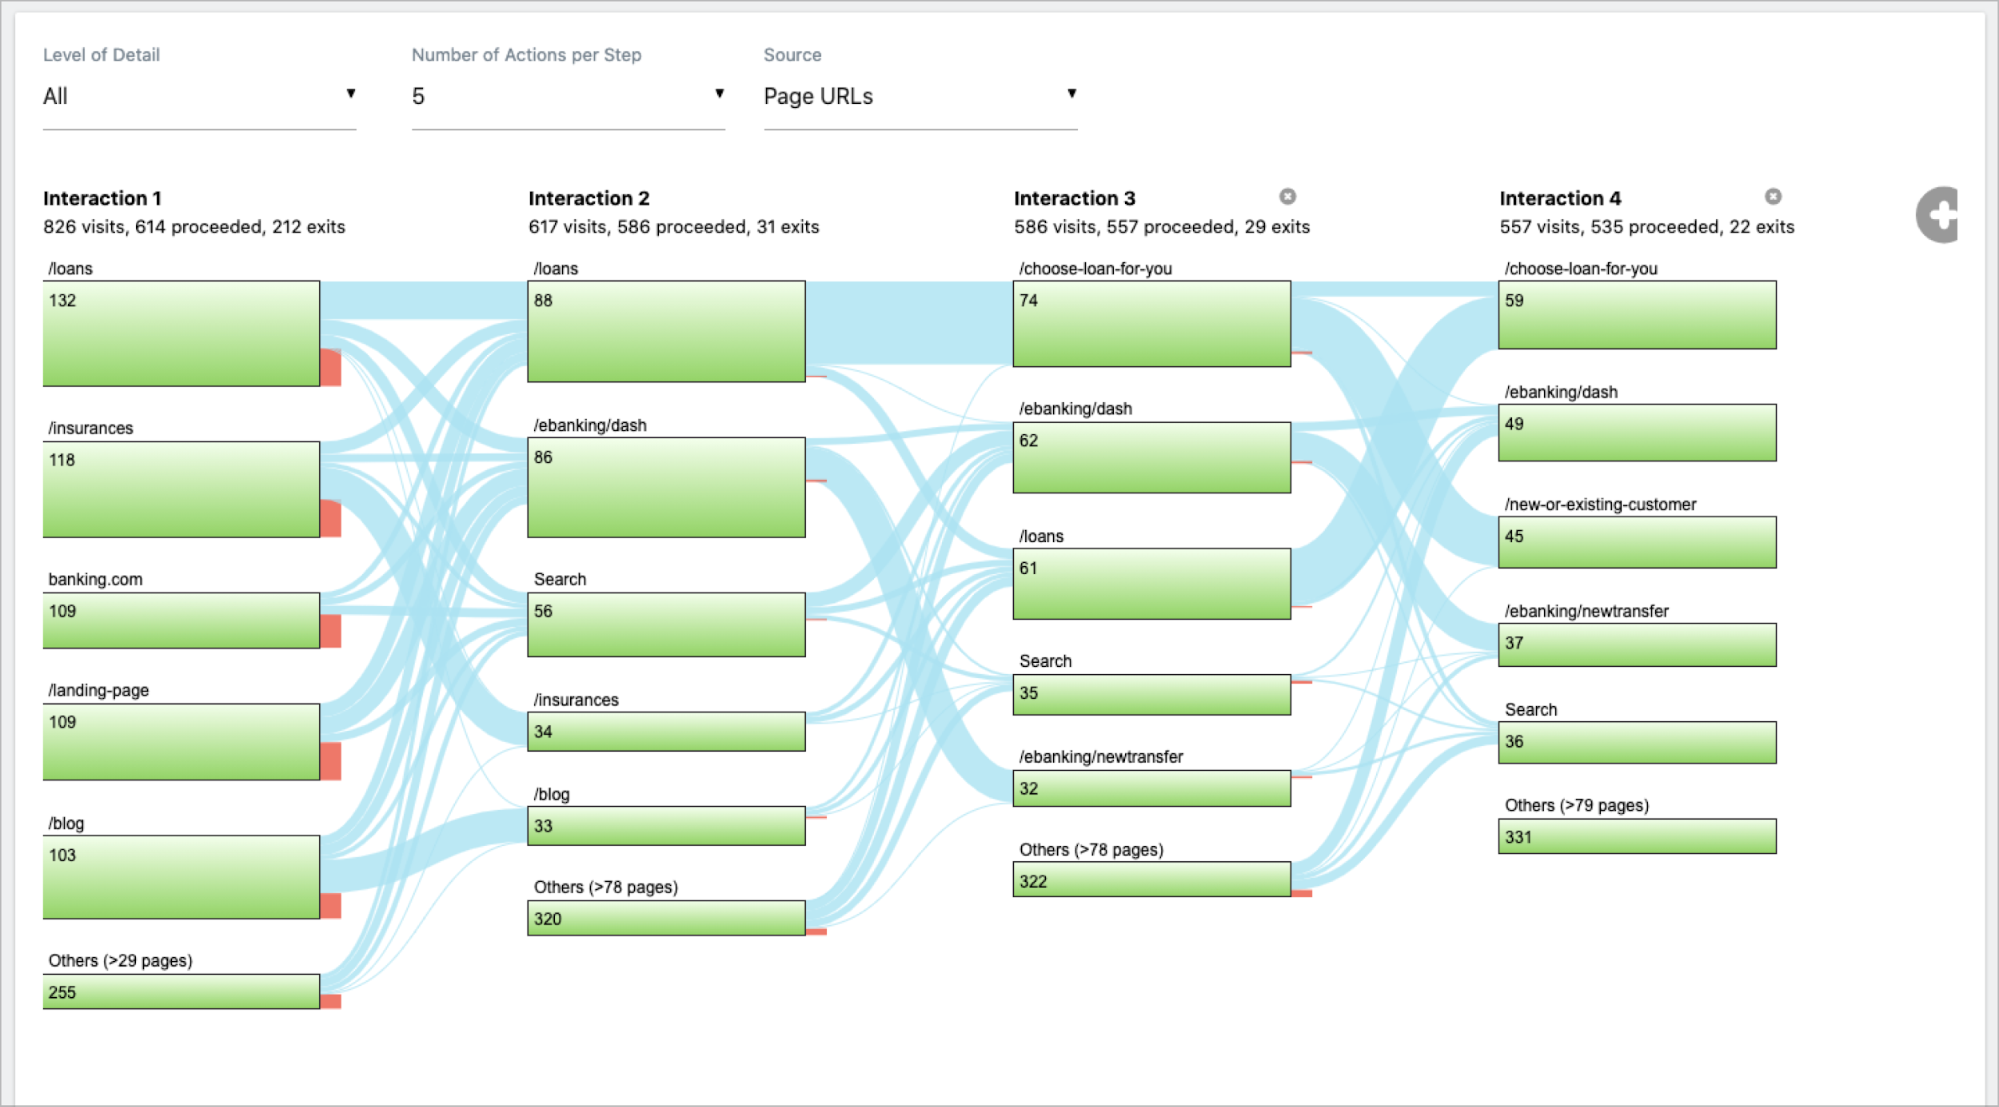
User flow and transition reports
Matomo’s user flow aggregates its nodes based on page URLs and page titles. That setting is applied for all steps at once. It’s because user flow reports are based only on page views and not custom events (e.g., clicking a particular button or link, viewing a piece of content or downloading a file).
Also, Matomo’s user flow reports work in strict mode only. This means that they report all events that occurred on the visitor path. As a result, the configured events must follow each other in the sequence, otherwise you’ll notice a drop-off and some interactions won’t be displayed. This limits your flexibility in creating user flow reports.
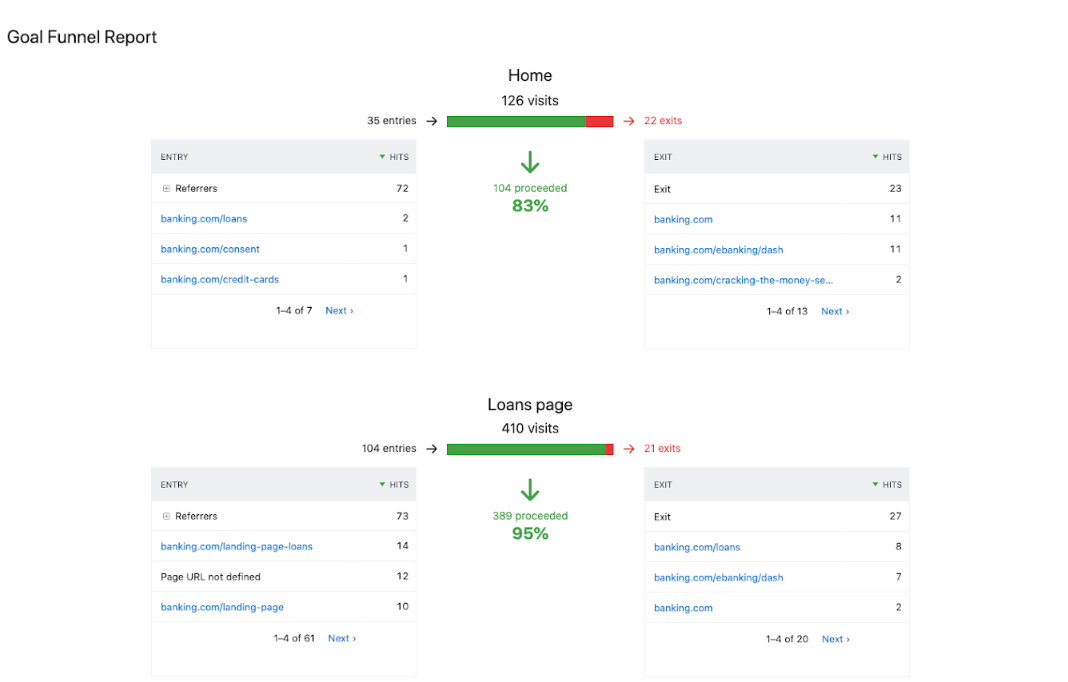
Funnels
Funnel reports in Matomo can consist only of page views and custom events, and have to include a goal. They’re not retroactive, meaning they won’t contain data from the time before the report was created. You’ll have to wait for your data set to grow over time to draw valuable conclusions from it.
Calculation of unique visitors
With archiving mode turned on, the platform also stops calculating unique visitors in real-time. Data about them is limited to the period of days, weeks and months.
Advanced analytics features
Finally, the limitations of Matomo’s backend impact the availability of advanced analytics functionalities such as:
- Dimension value grouping – Serves to organize values inside dimensions into custom groups. It helps you create clutter-free reports and better understand data specific to your website.
- Calculated metrics – These are the unique metrics that you can create out of existing metrics.
- Custom channel grouping – This functionality allows you to connect all traffic sources to your website in one channel grouping that you define.
None of these functionalities is available in Matomo.
To give you some point of reference, this is how Matomo compares to Piwik PRO Analytics Suite in the areas we’ve been discussing:
| Piwik PRO | Matomo | |
|---|---|---|
| Reports based on high traffic volume | Live | Pre-archived |
| Dashboards built out of custom widgets with separate filters and segments | ||
| Intuitive drag-and-drop report editor | ||
| Calculation of unique visitors | Fully available | Limited (Periods of days, months and years) |
| User flow reports | ||
| Funnel reports | ||
| Dimension value grouping | ||
| Custom channel grouping | ||
| Calculated metrics |
Possible solution: Push your data to BI tools to perform deeper analyses
To benefit from more in-depth business insights, you can onboard your data into external platforms, such as business intelligence (BI) tools.
In this scenario you’d use Matomo as a tracker and process the queries without communicating with the product’s UI. This would allow you to bypass the archiving process and take advantage of more advanced reporting methods offered by third-party platforms.
You can use Matomo mainly as a data collector. In this case, the data is usually transferred to a data warehouse and analyzed using a query language and BI tools. In such case, the Matomo user interface is used primarily for debugging purposes and for providing self-service digital analytics e.g. for marketing and communication teams.
Mikko Piippo, analytics specialist and founding partner at Hopkins Oy
The downside of this solution is that BI queries may still negatively impact the performance of the MySQL database and the tracker’s ability to collect data. To reduce the load, you could create a read-only replica of a primary database. This would require some serious technical skills on your end and increase your infrastructure costs.
What are your alternatives?
Matomo is a good choice for companies that can handle its maintenance, don’t mind the delay in accessing their reports or decide to export their data to BI tools for more advanced analyses.
But what if you want your web analytics platform to handle more in-depth reporting and take in medium or high traffic by default? Or the maintenance of Matomo is too much of a challenge for you? In such a case, you may want to consider other options.
In the Free comparison of leading enterprise-ready web analytics tools, we present side by side the four biggest web analytics platforms designed with medium- and high-traffic websites in mind: Google Analytics 360, Adobe Analytics, Countly Enterprise and Piwik PRO.
See how they perform in terms of:
- Feature sets
- Data freshness
- Hosting options
- Customer care & professional services
- Integrations
- Data privacy and security
Read it to find out which product best suits your needs.
And if you’d like to compare Matomo and Piwik PRO in more detail, this webinar will be a perfect source of information for you:
Comparing Piwik PRO and Matomo
How to overcome performance issues and lack of flexibility in your analytics?
Finally, in case of any questions, be sure to contact us. Our team will be happy to show you how our platform can provide you with fast access to reports and satisfy advanced business use cases.